Basic note
Metric Types
TLDR
| Type | Def | Usecase |
|---|---|---|
| Counter | A counter is a cumulative metric that only goes up (or resets to zero). Perfect for tracking totals over time. | - Use the rate() function for request/second visualizations - Create error percentage panels - Show total accumulated values over time |
| Gauge | A gauge represents a single numerical value that can go up and down. | - Create threshold alerts - Show current values with Stat panels - Display min/max/avg with Graph panels |
| Histogram | Samples observations and counts them in configurable buckets. Perfect for measuring distributions of values. | - Create heatmaps showing request distribution - Display percentile graphs over time - Set up SLO/SLA panels |
| Summary | Similar to histogram but calculates streaming φ-quantiles on the client side. | - Show quantile graphs - Create SLI dashboards - Monitor performance trends |
Counter
Definition
A counter is a cumulative metric that only goes up (or resets to zero). Perfect for tracking totals over time.
Usage
- Use the rate() function for request/second visualizations
- Create error percentage panels
- Show total accumulated values over time
Example
http_requests_total{method="POST", endpoint="/api/users"}
# Request rate over 5 minutes
rate(http_requests_total[5m])

# Total requests in last hour
increase(http_requests_total[1h])

# Error rate percentage
sum(rate(http_requests_total{status=~"5.."}[5m]))
  /
sum(rate(http_requests_total[5m])) * 100
Gauge
Definition
A gauge represents a single numerical value that can go up and down.
Usage
- Create threshold alerts
- Show current values with Stat panels
- Display min/max/avg with Graph panels
Example
memory_usage_bytes
cpu_temperature_celsius
connection_pool_size
# Current value
memory_usage_bytes

# Average over time
avg_over_time(memory_usage_bytes[1h])
# this will count from [now-1m, now]

# Max value in last day
max_over_time(memory_usage_bytes[24h])
Histogram
Definition
Samples observations and counts them in configurable buckets. Perfect for measuring distributions of values.
Usage
- Create heatmaps showing request distribution
- Display percentile graphs over time
- Set up SLO/SLA panels
Example
http_request_duration_seconds_bucket{le="0.1"}
http_request_duration_seconds_bucket{le="0.5"}
http_request_duration_seconds_bucket{le="1"}
# 95th percentile latency
histogram_quantile(0.95, rate(http_request_duration_seconds_bucket[5m]))

# Average latency
rate(http_request_duration_seconds_sum[5m])
  /
rate(http_request_duration_seconds_count[5m])

# Requests slower than 1s
sum(increase(http_request_duration_seconds_bucket{le="+Inf"}[5m]))
  -
sum(increase(http_request_duration_seconds_bucket{le="1"}[5m]))
Summary
Definition
Similar to histogram but calculates streaming φ-quantiles on the client side.
Usage
- Show quantile graphs
- Create SLI dashboards
- Monitor performance trends
Example
rpc_duration_seconds{quantile="0.5"}
rpc_duration_seconds{quantile="0.9"}
rpc_duration_seconds{quantile="0.99"}
# 90th percentile
rpc_duration_seconds{quantile="0.9"}

# Average calculation
rate(rpc_duration_seconds_sum[5m])
  /
rate(rpc_duration_seconds_count[5m])
Misc
Function
| Time | http_requests_total (counter) | rate(http_requests_total[2m]) = (last - first)/time_range (req/s) | irate(http_requests_total[2m]) = (last - previous)/time_range (req/s) | increase(http_requests_total[2m]) = last - previous (total req in time_range) | sum(rate(http_requests_total[2m])) (not much meaning if only one field used when have multiple servers) |
|---|---|---|---|---|---|
| 12:00:00 | 100 | - | - | - | - |
| 12:01:00 | 120 | - | - | - | - |
| 12:02:00 | 150 | (150 - 100) / 120 | (150 - 120) / 120 | 150 - 100 | same as rate() |
| 12:03:00 | 170 | (170 - 120) / 120 | (170 - 150) / 120 | 170 - 120 | same as rate() |
| 12:04:00 | 200 | (200 - 150) / 120 | (200 - 170) / 120 | 200 - 150 | same as rate() |
| Time | cpu_usage_percent (gauge) | avg_over_time(cpu_usage_percent[3m]) = (sum of all value in time_range) / number of value | max(cpu_usage_percent) |
|---|---|---|---|
| 12:00:00 | 40 | - | |
| 12:01:00 | 50 | - | |
| 12:02:00 | 30 | (30 + 50 + 40) / 3 | |
| 12:03:00 | 60 | (60 + 30 + 50) / 3 | |
| 12:04:00 | 10 | (10 + 60 + 30) / 3 |
95th percentile
Response times (ms): [10, 20, 30, 40, 50, 60, 70, 80, 90, 1000]
Total values: 10 data points

For 95th percentile:
- Position = 10 * 0.95 = 9.5
- Need to interpolate between 9th and 10th values
- 9th value = 90ms
- 10th value = 1000ms
- Interpolation: 90 + (1000-90) * 0.5 = 545ms
# 0.5 is fraction of the position

For 99th percentile:
- Position = 10 * 0.99 = 9.9
- Interpolate between 9th and 10th values
- 9th value = 90ms
- 10th value = 1000ms
- Interpolation: 90 + (1000-90) * 0.9 = 955ms
# 0.9 is fraction of the position
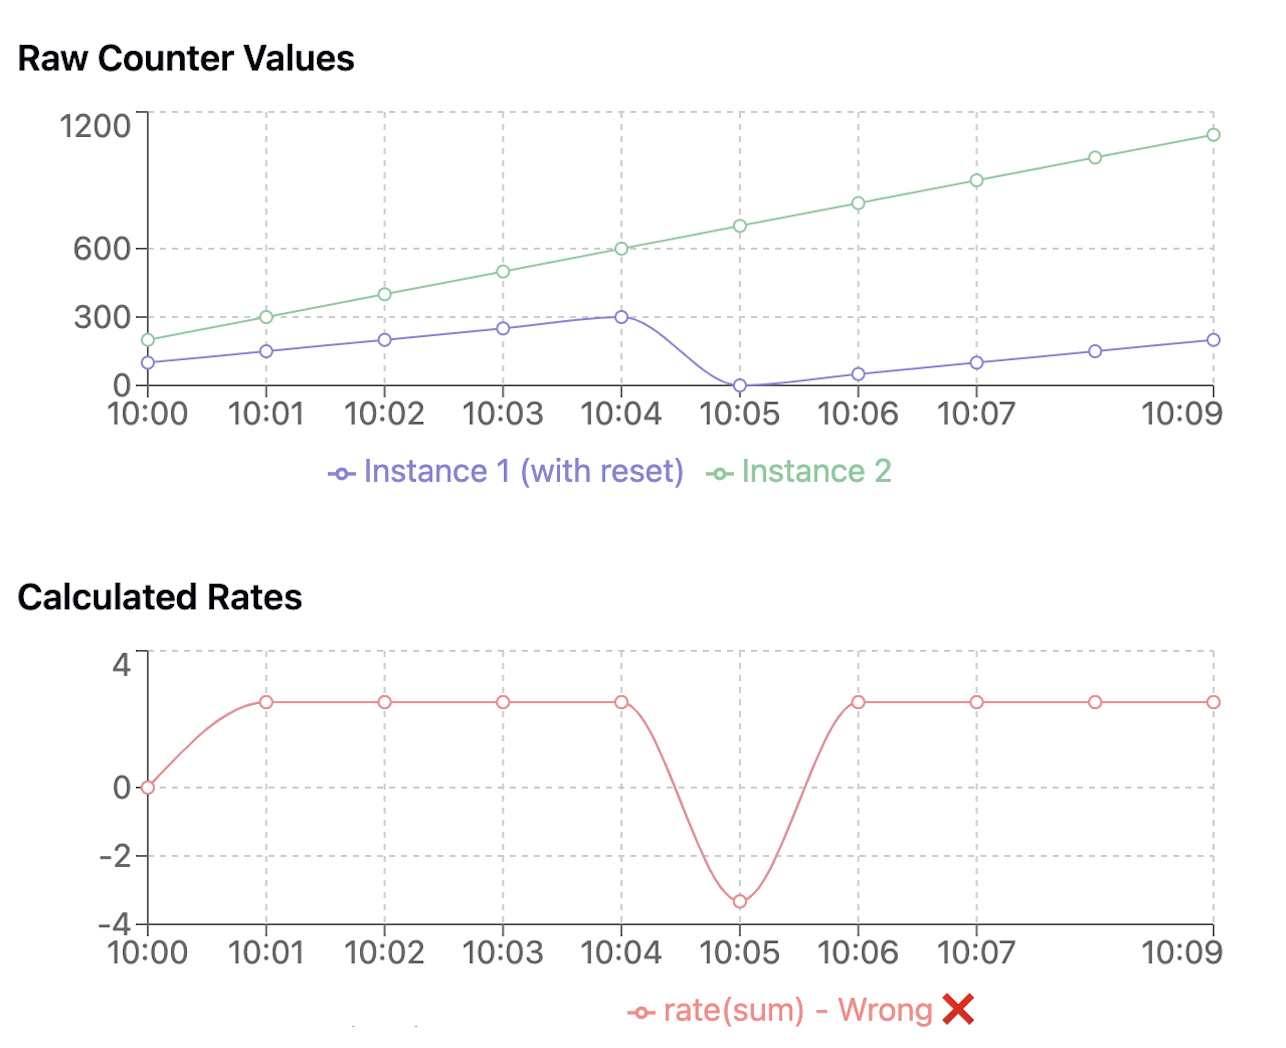
Counter: Why sum(rate) not rate(sum)
Instance1 counter values over time:
10:00 -> 100
10:01 -> 150
10:02 -> 200

Instance2 counter values over time:
10:00 -> 200
10:01 -> 300
10:02 -> 400

## with sum(rate()):
First calculate rates for each instance:
Instance1: (200-100)/120s = 0.83 req/s
Instance2: (400-200)/120s = 1.67 req/s

Then sum the rates:
Total rate = 0.83 + 1.67 = 2.5 req/s ✅


## with rate(sum())
First sum the counters (instance1 + instance2):
10:00 -> 300  (100+200)
10:01 -> 450  (150+300)
10:02 -> 600  (200+400)

Then calculate rate:
(600-300)/120s = 2.5 req/s

This looks same but... 🤔
what if counter is restarted?

Instance1:
10:00 -> 100
10:01 -> 150
10:02 -> 0
10:03 -> 50
10:04 -> 100

Instance2 counter values over time:
10:00 -> 200
10:01 -> 300
10:02 -> 400
10:03 -> 500
10:04 -> 600

At 10:02:
sum(rate([2m])) = sum(0 + 200/120) = 0 + 1.67 = 1.67 req/s
rate(sum([2m])) = rate(400 - 300)/120 = 0.83 req/s # drop down drastically (false alarm)

At 10:04: it will work normally after that
sum(rate([2m])) = sum(100/120 + 200/120) = 0.83 + 1.67 = 2.5 req/s
rate(sum([2m])) = rate(700 - 400)/120 = 2.5 req/s
